
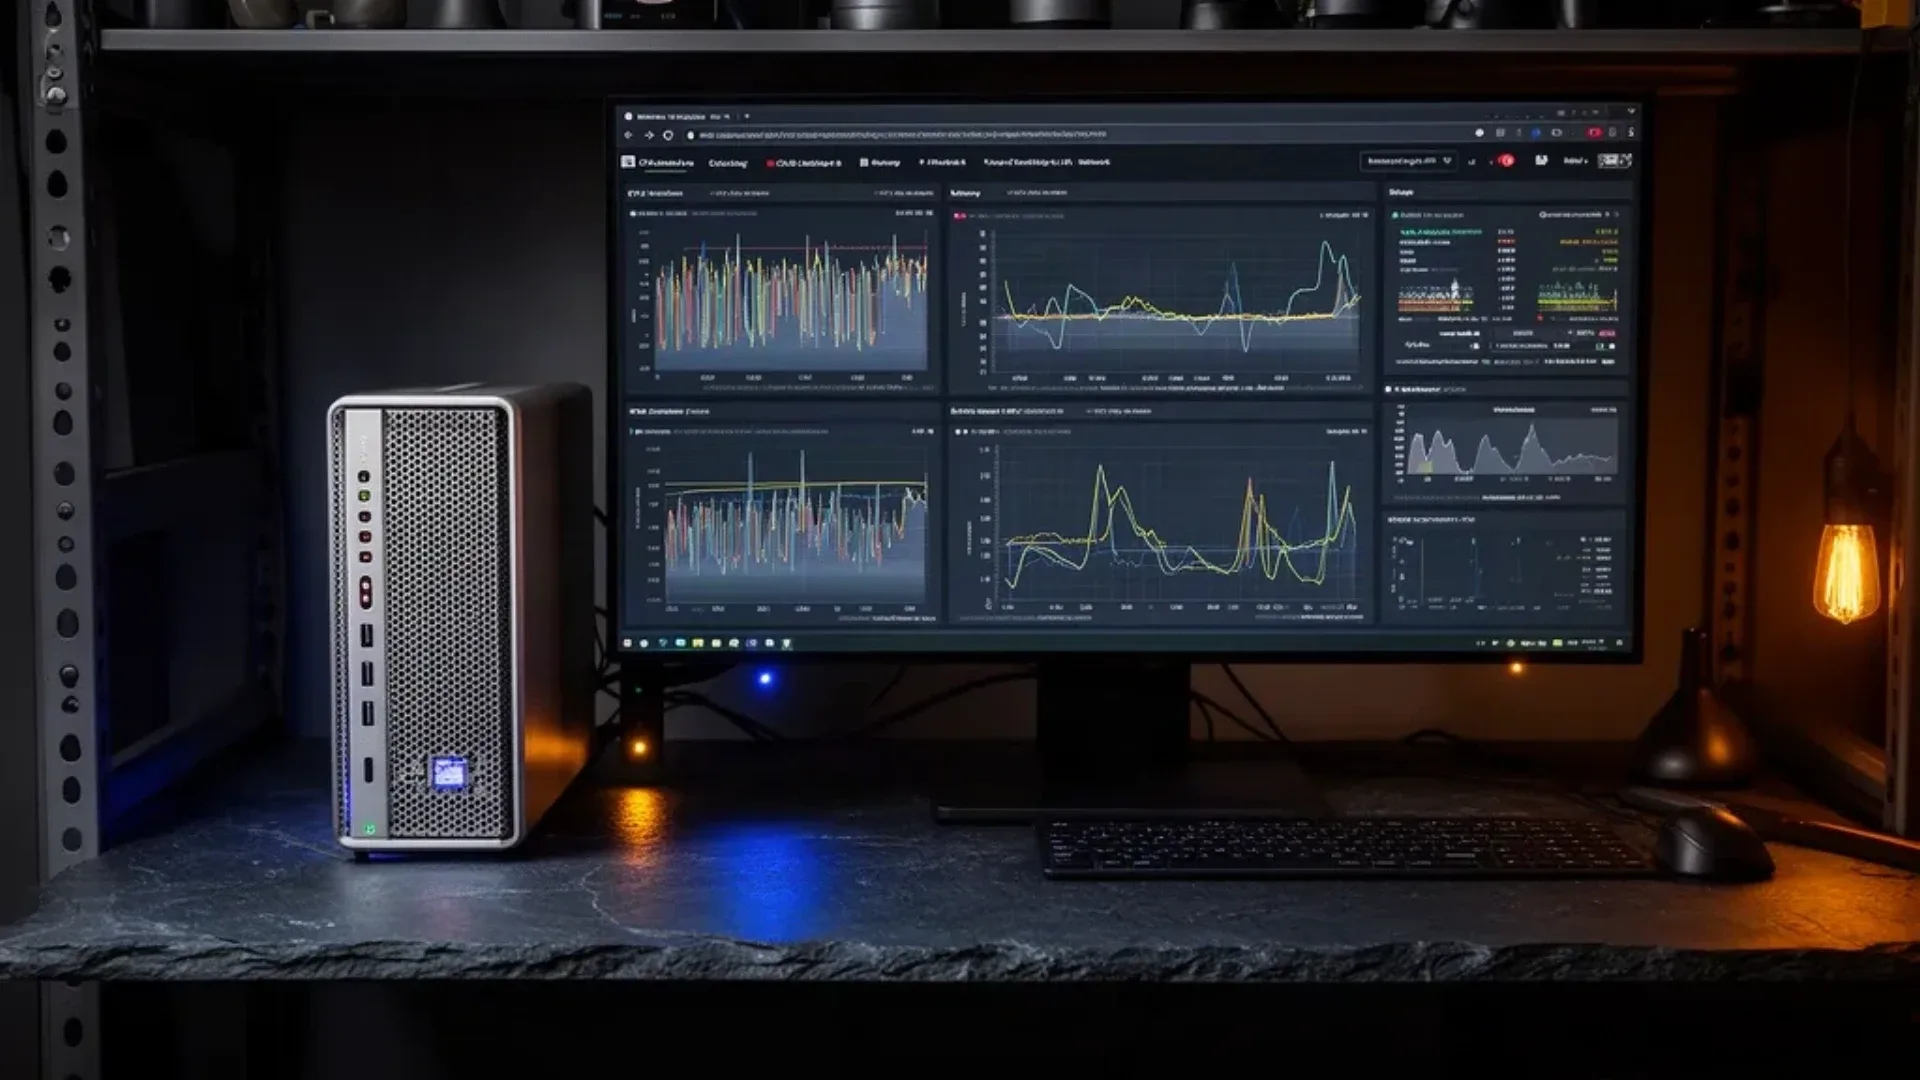
Grafana and Prometheus are a natural first monitoring stack for a homelab, but they are not free in the way a single utility container can be. Prometheus continuously scrapes targets, stores time-series samples, compacts its database, and answers dashboard queries. Grafana adds dashboards, users, alert rules, and query traffic.
A mini PC can handle that job well when the monitoring scope is deliberate. The mistake is starting with every exporter, a short scrape interval, unlimited labels, and years of retention on the same disk that stores the rest of the homelab. Monitoring should tell you when a service is unhealthy, not become the next service that needs rescuing.
This guide lays out the stack, a storage-growth model, useful first alerts, Docker deployment boundaries, and the point where a mini PC stops being a sensible monitoring host. Use the power cost calculator for the always-on cost, and see our mini PC home server guide for the host role.
What Prometheus and Grafana Each Do
Prometheus and Grafana are complementary rather than interchangeable:
| Component | Main job | Data it owns |
|---|---|---|
| Prometheus | Scrape, store, query, and alert on metrics | Time-series samples and rules |
| Grafana | Query data sources and display dashboards | Dashboards, users, preferences |
| Node Exporter | Expose Linux host metrics | Current host metrics endpoint |
| cAdvisor or an app exporter | Expose container or service metrics | Current exporter output |
| Alertmanager | Route and group Prometheus alerts | Notification state and routing |
The Prometheus overview describes the pull model. Prometheus periodically requests metrics from HTTP endpoints. That design makes target discovery and firewall rules important, because the monitoring host must reach every target it scrapes.
Grafana does not magically collect metrics. Its Prometheus data-source documentation explains the connection between a dashboard and a Prometheus endpoint. If Prometheus is down, Grafana can still open, but new queries and alerts based on that data will not work.
Is a Mini PC Enough?
For a small home lab, yes. A mini PC has enough CPU for Prometheus scraping and Grafana queries when the target count and label set remain controlled. The stack is heavier than a single DNS or dashboard container because it writes data continuously and keeps indexes in memory.
The relevant variables are not just CPU cores:
- Number of scrape targets
- Number of active series per target
- Scrape interval
- Label cardinality
- Retention duration
- Dashboard query complexity
- Alert rule frequency
- Storage speed and free space
An N100 class host is a sensible starting point for a personal lab with a handful of targets and short to moderate retention. Choose a stronger host with more memory and SSD space when the same mini PC also handles photo machine learning, video transcoding, several virtual machines, or a large container estate. The VM capacity estimator helps when monitoring is one workload among many.
The most reliable scale-up lever is often reducing unnecessary metrics and retention. Buying a bigger CPU does not fix an uncontrolled label set or a disk that is already full.
Prometheus Storage Growth in Plain Terms
Prometheus stores samples in a time-series database. Each active series produces samples at the configured scrape interval. A series is identified by a metric name and its labels, so careless labels can turn a small number of targets into a very large database.
The basic planning model is:
samples per day = active series × scrapes per second × 86400
retained samples = samples per day × retention days
storage need = retained samples × bytes per sample plus index and compaction space
The final storage number cannot be guessed honestly from the sample count alone. Compression, chunks, indexes, WAL data, compaction, and label sets affect the result. The Prometheus storage documentation explains the local TSDB and retention settings.
For planning, use a representative interval. A 15-second scrape interval produces four samples per minute for each active series. If a target exposes 5,000 active series, that is 20,000 samples per minute before adding another target. The example is arithmetic, not a universal recommendation. Many labs need fewer metrics, while an exporter with high-cardinality labels can need far more.
Start with a retention window that matches a real question. Seven to thirty days can answer recent outages and capacity changes. Longer retention is useful for seasonal comparisons, but it increases storage and backup obligations. If you need years of metrics, consider remote storage or a dedicated monitoring system rather than growing one mini-PC volume indefinitely.
Choose Metrics Before Dashboards
Install the Prometheus Node Exporter on Linux hosts that you want to observe. It exposes host metrics for CPU, memory, filesystems, network interfaces, and other operating-system areas. The exact collectors and labels should be chosen from the current project documentation.
Add application exporters only when they answer a useful question. Good first questions include:
- Is the host reachable?
- Is the root or data filesystem filling?
- Is memory pressure affecting services?
- Are containers restarting?
- Is the backup job succeeding?
- Is a database refusing connections?
- Is a certificate close to expiry?
Avoid adding an exporter because a dashboard screenshot contains many lines. Every metric has a cost in samples, queries, storage, and attention. A small dashboard that answers an incident question is more useful than a wall of gauges no one reads.
A Practical Docker Layout
Docker Compose is a reasonable way to run Grafana, Prometheus, and exporters on a mini PC. Keep Prometheus data, Grafana data, and configuration in separate persistent locations. The Docker Compose documentation covers the deployment model, while the official Prometheus and Grafana documentation should supply current image names and environment settings.
Create a directory structure:
sudo mkdir -p /srv/monitoring/prometheus
sudo mkdir -p /srv/monitoring/grafana
sudo mkdir -p /srv/monitoring/config
cd /srv/monitoring
The important Compose shape is simple:
services:
  prometheus:
    volumes:
      - /srv/monitoring/config/prometheus.yml:/etc/prometheus/prometheus.yml:ro
      - /srv/monitoring/prometheus:/prometheus
  grafana:
    volumes:
      - /srv/monitoring/grafana:/var/lib/grafana
This is a storage example, not a full release-pinned deployment. Use the current Prometheus getting-started guide for the configuration syntax and the current Grafana container documentation for permissions and initialization.
Start with a configuration that scrapes Prometheus itself and one host exporter:
docker compose pull
docker compose up -d
docker compose ps
docker compose logs --tail=100 prometheus grafana
Add targets one at a time. A configuration error can stop all new scrapes, so validate the file before replacing a working configuration. Keep the previous configuration available until the new targets appear in the Prometheus targets page.
Build the First Dashboard
Begin with four panels:
- Host availability and scrape health
- CPU pressure and load trend
- Memory use and swap activity
- Filesystem free space and write errors
Then add network traffic, temperatures, container restarts, and application-specific panels. Use time ranges that match the question. A five-minute view helps with an active incident. A seven-day view helps expose scheduled jobs and gradual storage growth.
Keep dashboard queries readable. A query that scans every label and every target may look fine with one host and become slow later. Use variables for a small set of targets, not an unrestricted selector that asks Prometheus to return the entire database for every panel.
Alerts That Matter on a Mini PC
Monitoring becomes useful when it produces an action. Start with alerts that have a clear owner and response:
| Alert | Why it matters | First response |
|---|---|---|
| Target missing | The service or exporter may be down | Check host and network |
| Filesystem low | Metrics and application writes can fail | Remove data or expand storage |
| Backup stale | Recovery point is older than expected | Inspect the backup job |
| Container restarting | A service may be crash-looping | Read logs and inspect limits |
| Memory pressure | Services may be evicted or slowed | Find the largest workload |
| Temperature high | Cooling or sustained load may be wrong | Check airflow and workload |
Do not set every alert to a low threshold. A warning that fires every day becomes background noise. Record the intended response and the acceptable duration for each condition.
Alertmanager can group alerts and route notifications, but it is another service with its own configuration and failure behavior. Add it after the first Prometheus alerts are understandable. The Prometheus alerting documentation explains the separation between alert rules and notification routing.
Backups and Retention
Prometheus local storage is operational history, not a backup by itself. Back up the Prometheus configuration, alert rules, Grafana dashboards, Grafana data, and any notification configuration. Decide whether the metric history is worth restoring or whether a fresh Prometheus with documented rules is sufficient.
The local TSDB has write-ahead-log and compaction behavior, so do not assume that copying a live directory with a generic file command creates a consistent restore. Use the current Prometheus guidance for snapshots or remote storage. Export Grafana dashboards or keep them in version control without secrets.
Retention is a risk control. A shorter window limits disk growth and reduces recovery size. A longer window supports trend analysis but requires more capacity and a clearer backup policy. Check the disk as part of the monitoring stack itself, and leave enough free space for compaction and temporary writes.
Troubleshooting the Stack
Prometheus shows a target as down. Check network reachability, the target port, the exporter service, and the scrape path. A firewall rule that blocks the monitoring host can look like an application failure.
Grafana has no data. Confirm the Prometheus data source URL from inside the Grafana container network. Then check whether Prometheus has any samples for the selected time range.
The disk grows faster than expected. Inspect active series, scrape intervals, retention, label cardinality, WAL data, and compaction. Find the target that changed before increasing the disk.
The mini PC feels slow. Look for expensive dashboard queries, high-cardinality exporters, compaction activity, and unrelated workloads. Reduce the monitoring scope before moving every service to a larger machine.
Alerts stopped during an outage. The monitoring stack may share the failure domain it observes. Add a second lightweight probe or external check for the few services whose availability matters most.
Who Should Use a Mini PC and Who Should Skip It
Use a mini PC when you want local dashboards and recent history for a personal homelab. Keep the target set deliberate, use SSD storage, choose retention from actual questions, and monitor the monitoring disk. An N100 class host is a reasonable start for a small deployment.
Skip a single mini-PC Prometheus when it must retain years of data, scrape many high-cardinality systems, or remain available while the entire homelab is down. A separate monitoring host or managed service provides a better failure boundary. Three dashboards on one host do not make the monitoring independent.
Frequently Asked Questions
Can a mini PC run Grafana and Prometheus?
Yes. A mini PC is a practical host for a small homelab monitoring stack when Prometheus retention, active series, and dashboard queries fit the available storage and memory. The stack is heavier than one simple container because it continuously stores time-series data.
How much storage does Prometheus need?
Prometheus storage depends on active series, scrape interval, label cardinality, retention time, and the number of targets. There is no honest fixed number for every homelab. Estimate samples over time, measure the first real workload, and keep a reserve for growth.
Is Prometheus a database?
Prometheus includes a local time-series database designed for metrics and recent operational history. It is not a general replacement for a relational database or a long-term archive. Use the Prometheus storage documentation when deciding retention and remote storage.
Does Grafana store Prometheus metrics?
Grafana queries Prometheus as a data source and stores its own dashboards, users, and configuration separately. Prometheus owns the local metric history in this design. Back up both the Grafana data and the Prometheus data when both matter.
What should I monitor on a mini PC homelab?
Start with host availability, CPU pressure, memory, filesystem space, filesystem errors, temperature, network state, container health, and backup success. Add application metrics only when they answer a decision or alert that matters.
Who should skip Prometheus on a mini PC?
Skip local Prometheus when you need a large multi-year metrics archive, many high-cardinality targets, or a monitoring system that must remain independent of the host it observes. Use a dedicated monitoring host or a managed metrics service for that boundary.
Sources and Scope
This guide follows the Prometheus documentation, its storage documentation, the Grafana Prometheus data-source guide, the Node Exporter project, and the Docker Compose documentation. Storage math is a planning model. No universal resource figure, power reading, or first-party benchmark is claimed.